REFELCTION:
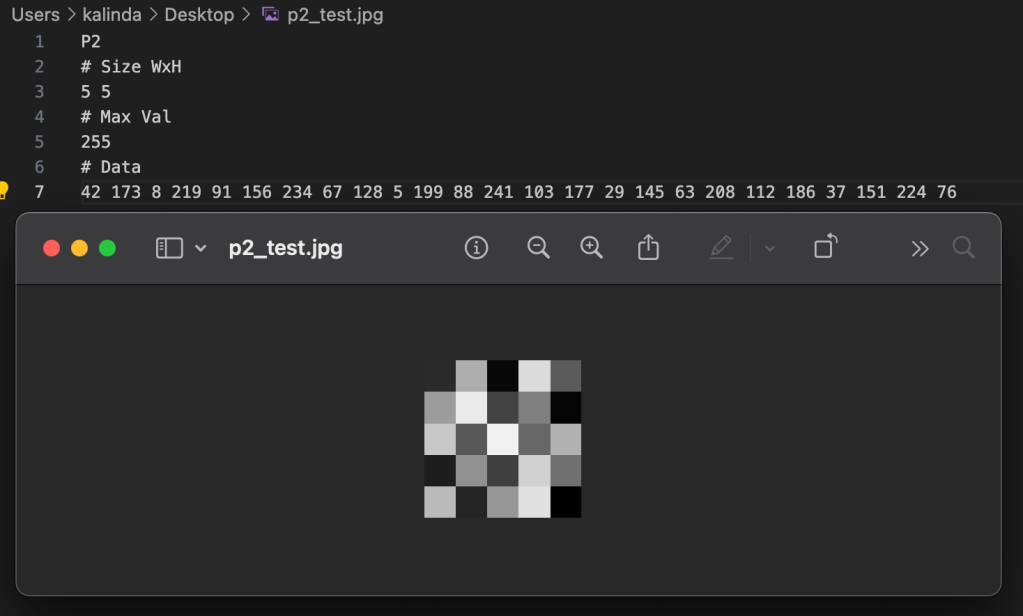
In this class we reviewed a lot of how computers process pixel data and what makes something 8-bit vs 64-bit. I appreciated how breaking down the actual properties of a pixel and how that data is stored/displayed made me understand how each piece plays into images and video overall.
.˳·˖✶◉‿◉✶˖·˳.
ASSIGNMENT // READING RESPONSES:
Readings:
- The Automatons of Yesteryear, Katie Hiler, 2013, New York Times
- Are We Automating Racism?, Glad You Asked , 2021, VOX
Response:
It is interesting to look back on these pieces now with the absolute explosion of ‘artificial intelligence’ and machine learning models that largely dominate anything that tech companies are doing currently. I can really appreciate how Vox tried to visualize the process of how algorithms and machine learning works and shed light on the fact that while we can learn about the process, it can often be difficult or even impossible to know exactly what certain models are trained on.
Removing the generative AI arms race from the picture, we also see a lot of bias and surveillance technology pop up in our daily lives and that are being weaponized to new levels with the increase in activity from ICE. How is it that a company like Flock be allowed to compile so much data, more often than not unwillingly, and use it to exploit people?
It isn’t just about training data cropping photos anymore, the way machine learning has been weaponized against people in their daily lives is genuinely concerning and worrisome. The speed at which they are deployed and put into circulation don’t even give pause to allow for scrutiny or thought. This, of course, is largely by design for a select few to profit and benefit while the rest of society finds ways to deal with and live with the fall out from those decisions at the cost of their privacy, livelihood, or even life.
I think it should be mandatory for all companies to not only post about their algorithms but allow people to opt out. If I had known when I was 14 and made my first Facebook page that my face would later be used to train machine learning models that enact violence and largely gut any sense of privacy I had I am not sure I would have taken part. It is certainly a weird generation to be in as a millennial where you watch a lot of the fun corners of the Internet and technology morph into something far more harmful and sinister with no way of opting out or saying no because you signed away your right to it long ago.
To be clear, I am not fully against algorithms or robots. I think a lot of technology is really fun and cool. That fact is a big reason why I decided to go back to school and enroll in ITP. I even have dabbled in creating my own machine learning models with image data and find how computers process images fascinating. That being said, I do think that we need to have more tech literacy, increased openness around training data, and to seriously slow down the pace of production to allow us to take in the ramifications of what is being released and who we are hurting or what we lose when we cut this step out.
We owe it to ourselves to recognize our own bias and shortcomings and how we pass those onto machines we dub as God-like in their knowledge and decision making. We also owe it to ourselves to retain more human touch and thought in these processes because it is a deeper question of humanity. Just because we can automate and outsource to a machine doesn’t mean we should or have to.
.˳·˖✶◉‿◉✶˖·˳.
ASSIGNMENT // BOT POV:
Build a custom POV of a BOT that uses Digital Imaging Processing.
Constraints:
- Takes images as inputs and delivers processed images as outputs.
- The BOT should be able to:
- Sense its environment
- Take a picture of you and save the file
Thought Starters:
- How do you interact with the BOT?
- Does this interaction serve any purpose?
- Can you make this interaction more playful?
- How does the technology enhance or constrain the experience?
My BOT POV:
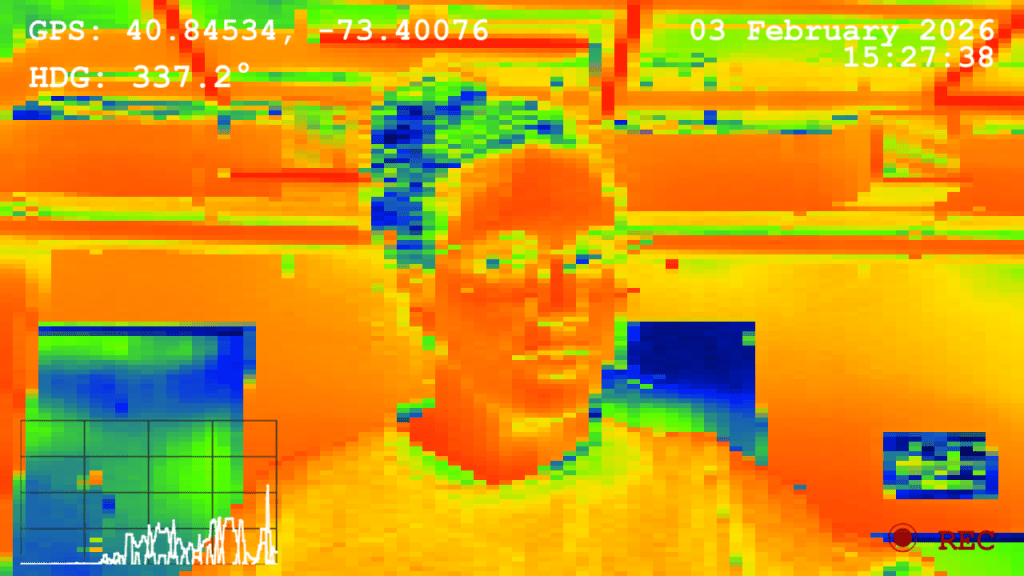
For my BOT POV I decided to simulate a pixelated ‘heat map’ pattern that incorporates live data into the field of view using TouchDesigner and data parameters collected from my iPhone. I figured that a BOT might view things in less color detail than a human would but would have more sensitive input of external variables, such as direction or movement speed. I also have been thinking about the basic BOT diagram of input ➔ processing ➔ output, and how displaying some input data along with an image would be interesting.
To start on my speculative BOT POV, I started by creating the look of the video feed using my desktop camera. I first input the video feed and then flipped it along the x-axis so it wouldn’t be a mirror image. I then used a monochrome TOP to make the video black and white and layered a level TOP on top of that so that I could adjust the various parameters such as brightness and contrast.
Once I got the greyscale to the place I liked, I added a ramp TOP and fed both that and the black and white video feed into a look up TOP. This allowed me to adjust the colors along the ramp to give it a ‘heat map’ look even though it is simply mapped to black and white values on a sliding scale.
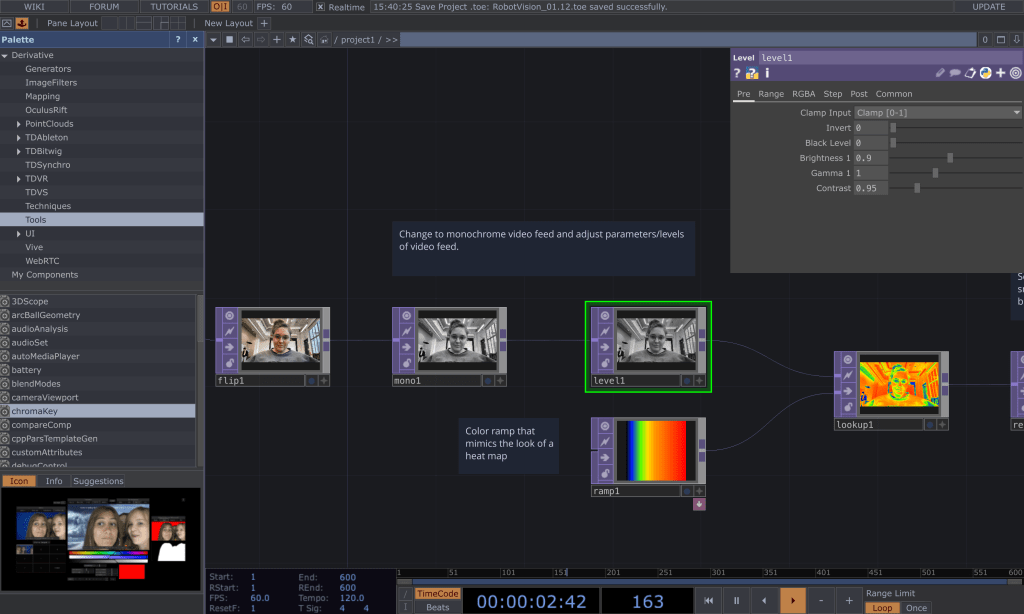
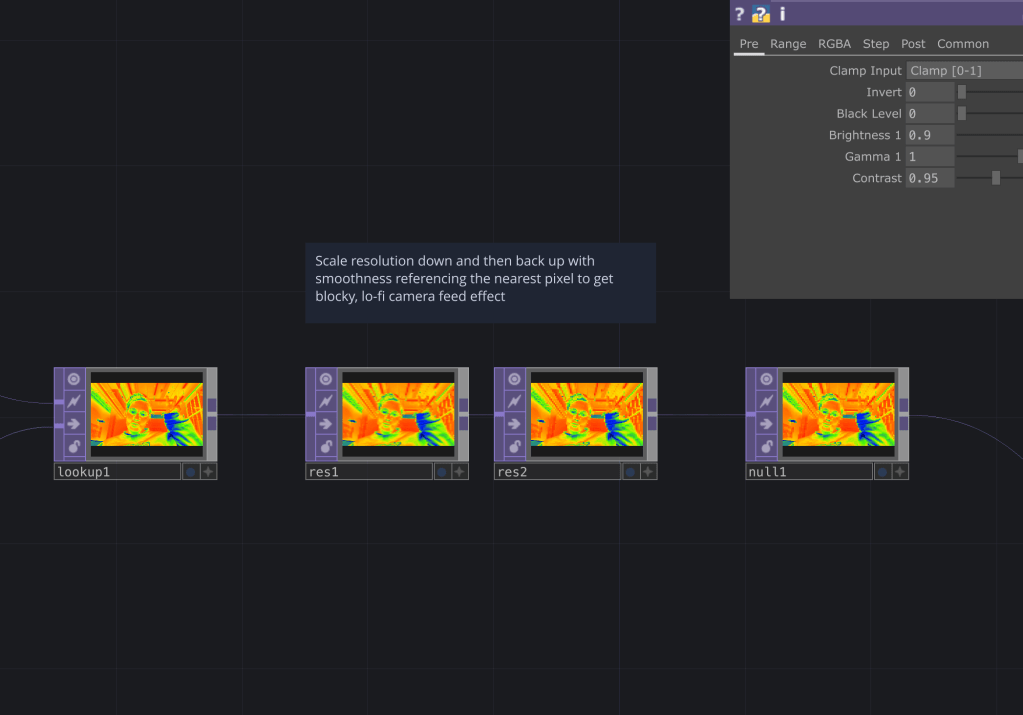
After I got the heat map to display the colors I liked, rather than using a simple ‘pixelate’ filter, I decided to use a combination of downscaling and upscaling resolution to achieve a pixelated look.
To do this, I took the camera feed and downscaled it significantly so that a lot of the pixel detail was gone. I then upscaled the image back to the original and told the system to use pixel info from the nearest pixel in order to generate the image. This allowed a composite of both the extremely downgraded image and an upscaled image based off that to take form, leading to the somewhat imprecise pixelated view.
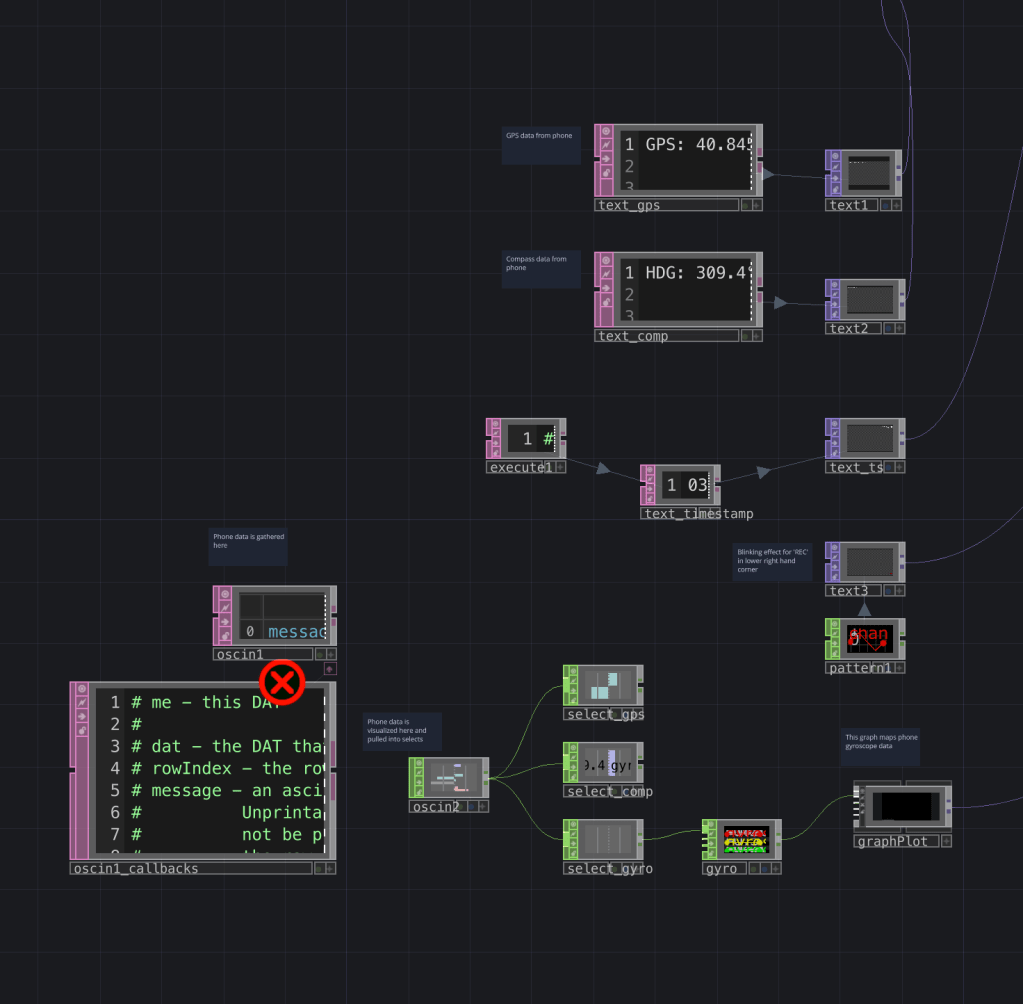
Once I was satisfied with the aesthetics of the video feed output, I went to Claude to see how I could hook up my phone data to TouchDesigner since I had no prior experience with that. There were a couple of apps suggested that allow me to stream phone data through WiFi (I chose GyrOSC), and I was able to quickly get that up and running using OSC In and Selects to capture individual data points. I also had Claude help with some of the Python scripting because while I could hook up the data to the text boxes itself for the video overlay, it was difficult to get it to display in the way that I wanted it to. In the end I decided to use compass direction, GPS coordinates, a line graph of gyroscope data, along with date and time.
After all this, it was only then I realized that using the camera feed on my phone would shut off the feed for all the other sensors (apparently an iOS limitation), which was really frustrating because the whole concept was to experience what the phone was experiencing via live phone camera and data feed. Apparently, there are workarounds with other camera app add-ons but I decided to just leave it as is with the computer camera for now.
Last but not least, I added in the ability to capture a screen cap by pressing ‘add frame’ in a Video File Out TOP. And here we have it- my final speculative BOT POV!

.˳·˖✶◉‿◉✶˖·˳.
While overall I am really happy with how this came out, some ideas for future iteration are…
- Use of an external camera on an actual BOT
I think it would be really cool to attach a camera to something I could control with a remote control and make it move around. - More input data
I think it would be interesting to build something that has input data directly wired into it rather than just using the defaults from my phone. - Visual interactivity driven by data
It would be interesting to have the vision be impacted by some of the external data more (ex. have the colors be influenced by phone compass data). - Live phone camera and data feed working together
The phone data and camera not being able to work at the same time was pretty frustrating, but with a little more time experimenting, there are some apps that I could potentially use to get around this. - Coding purely in Python
I would like to learn Python more so I think I would like to try coding purely in that language. This experiment also served as an exploration for transmitting data to and from TouchDesigner, which I need for my thesis, so I figured I would use this project as a way to get more comfortable with the program, and although it involved some Python, I’d like to go deeper.
.˳·˖✶◉‿◉✶˖·˳.
Resources I found helpful throughout this process:
- Claude was used specifically for debugging some of the overlay process, debugging some trouble I ran into with the blinking ‘REC’ overlay, as well as help with scripting inside TouchDesigner when gathering phone data
- This YouTube tutorial by The Interactive & Immersive HQ taught me how to do text overlay in TouchDesigner
- This blog post/tutorial by The Interactive and Immersive HQ taught me how to simulate a ‘heat map’ visual effect
- I referenced the recording of a TouchDesigner class I took with Grey Area to help with use of waves and creating the blinking text
⠀⠀⠀⠀⠀⠀⠀⠀⠀⠀⠀⠀⠀⠀⠀⠀⠀⠀⠀⠀⠀⢀⠀⠀⠀⠀⠀⡀⠀⠀⠀⠀⠀⠀⠀⠀⠀⠀⠀⠀⠀⠀⠀⠀⠀
⠀⠀⠀⠀⠀⠀⠀⠀⠀⠀⠀⢀⣄⠀⠀⢿⡇⠀⠀⣾⢀⣸⣄⠀⢠⡐⡄⣹⠀⣄⠀⠀⠀⠀⠀⠀⠀⠀⠀⠀⠀⠀⠀⠀⠀
⠀⠀⠀⠀⠀⠀⠀⠀⡀⠀⢧⢘⣼⣤⠴⠾⣿⡛⠋⣿⡏⢹⡏⠉⣽⢻⢛⡟⢲⡿⣤⣠⣆⡔⠀⠀⠀⠀⠀⠀⠀⠀⠀⠀⠀
⠀⠀⠀⠀⠀⠀⠀⠀⢻⣤⡼⠿⣟⣿⣷⣤⣸⣿⣦⣿⣷⣿⣷⣾⣿⣿⣿⣷⣟⣁⣴⡿⠟⠲⣤⣴⠃⠀⢀⠄⠀⠀⠀⠀⠀
⠀⠀⠀⠀⠀⠰⣼⣶⣎⣉⣙⣿⣿⠿⢻⣿⠟⠋⠉⠙⢟⣛⠀⠀⠀⠙⠟⢿⡙⠛⠿⣶⣶⡾⠋⢉⣳⣴⡟⡠⠀⢀⢀⠀⠀
⠀⠀⠀⠠⣄⣠⣋⣉⣹⣿⠟⠋⠀⠀⡾⠁⠀⠀⢀⣾⣿⣿⣿⠷⠀⢤⡀⠈⣷⠀⠀⠀⠉⠻⢿⣿⣿⡿⠛⢧⣠⣾⠞⠀⠀
⠀⠀⠦⣀⣞⣭⣽⡿⠟⠁⠀⠀⠀⠀⡇⠀⠀⠀⢸⣿⣿⣿⣿⣄⣀⣠⠇⠀⢸⠀⠀⠀⠀⠀⠀⠈⠛⣾⣿⣿⣯⠴⠂⣀⡴
⠀⠐⠦⠴⣶⡿⡟⠀⠀⠀⠀⠀⠀⠀⣷⠀⠀⠀⠘⢿⣿⣿⣿⡿⠃⠀⠀⠀⡿⠀⠀⠀⠀⠀⠀⢀⣾⣿⣭⣍⡉⠉⠉⠁⠀
⢠⠎⢩⠟⠋⢃⢳⠀⠀⠀⠀⠀⠀⠀⠘⣷⡀⠀⠀⠀⠀⠉⠀⠀⠀⠀⢀⡾⠁⠀⠀⠀⠀⣀⣴⣿⣟⣋⠉⠉⡓⠦⠀⠀⠀
⠘⣄⠘⠒⠒⠘⠢⠧⢤⣀⡀⠀⠀⠀⠀⠈⠻⢦⣀⠀⠀⠀⠀⢀⣀⡴⠛⠁⠀⠀⣀⣤⣾⣿⣏⡉⠉⢉⡿⠿⠀⠀⠀⠀⠀
⠀⠀⠉⠁⠀⠀⠀⠦⢤⡾⣿⡿⣷⣶⣦⣤⣄⣀⣈⣉⣉⣉⣉⣉⣁⣠⣤⣴⣾⡿⣿⣿⢧⡀⠈⣹⠶⠋⠀⠀⠀⠀⠀⠀⠀
⠀⠀⠀⠀⠀⠀⠀⠀⠀⠈⠓⠤⣋⠁⡼⠛⠛⡿⣿⠖⢛⣿⠛⠛⣿⡟⠛⠻⣿⡱⠄⠉⣣⠼⠊⠁⠀⠀⠀⠀⠀⠀⠀⠀⠀
⠀⠀⠀⠀⠀⠀⠀⠀⠀⠀⠀⠀⠀⠉⠓⠤⢤⣹⣁⠀⢸⡇⠀⠀⠸⡃⣀⣀⠬⠷⠒⠉⠀⠀⠀⠀⠀⠀⠀⠀⠀⠀⠀⠀⠀
⠀⠀⠀⠀⠀⠀⠀⠀⠀⠀⠀⠀⠀⠀⠀⠀⠀⠀⠀⠉⠉⠉⠉⠉⠉⠉⠀⠀⠀⠀⠀⠀⠀⠀⠀⠀⠀⠀⠀⠀⠀⠀⠀⠀⠀

Leave a comment